1
Capture HTTP/HTTPS Traffic
Inspect live requests and responses in plain text while the full debugging context stays attached to the session.
Loading
APXY brings live HTTP and HTTPS traffic into a warm, readable workflow. Capture failures, inspect payloads, mock unstable endpoints, and hand your AI agent the exact network context it needs to debug with confidence.
curl -fsSL https://apxy.dev/install.sh | bashOr read the documentation
APXY gives coding agents CLI control to inspect live traffic, compare failing requests, create mocks, and verify fixes directly from the terminal.
Inspect live requests, manage mock rules, and test network behavior in one place so you can understand issues fast and stay in control of the full flow.
Inspect live requests and responses in plain text while the full debugging context stays attached to the session.
Create and test mock rules directly in APXY so you can change responses, reproduce edge cases, and validate fixes before touching the upstream service.
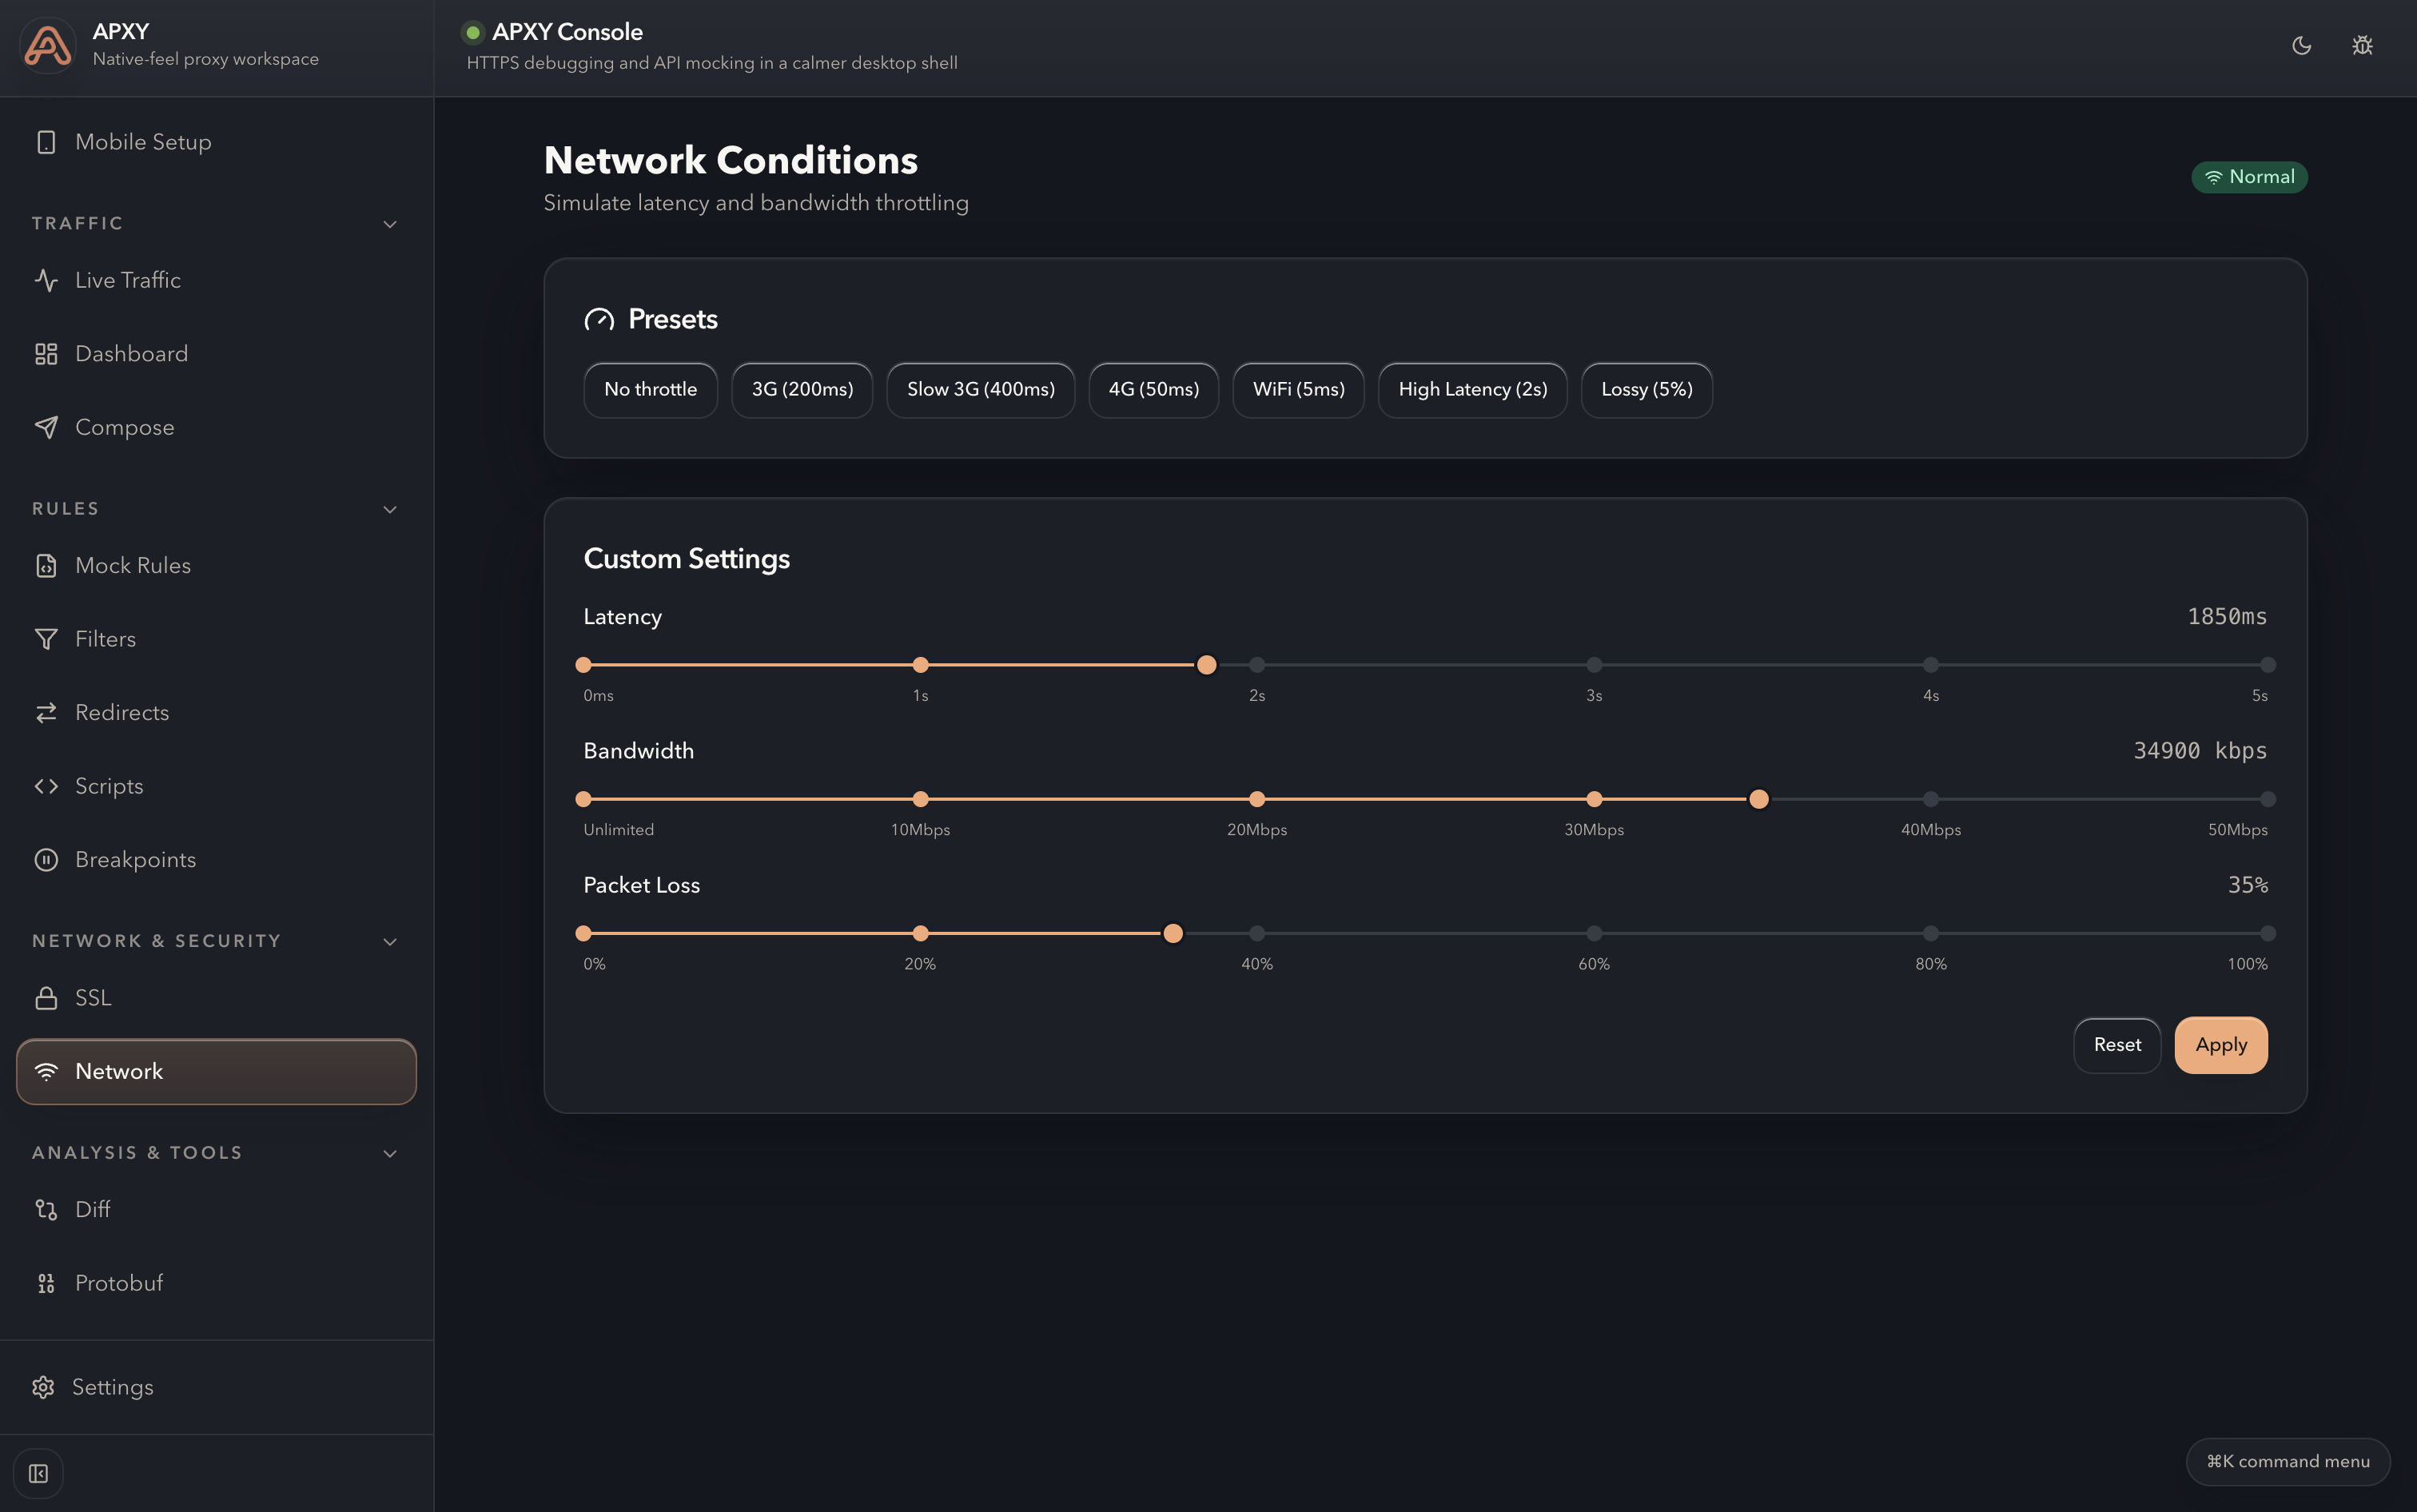
Throttle latency, bandwidth, and packet loss to reproduce bad-network behavior before users hit it.
Capture HTTP and HTTPS traffic from physical devices, iOS simulators, and Android emulators so mobile bugs come with the exact request and response evidence instead of screenshots and guesses.
Step 1
The desktop app keeps device selection, QR setup, and connection status in one place. Users can see the supported target, launch the phone guide, and confirm when the device is online.
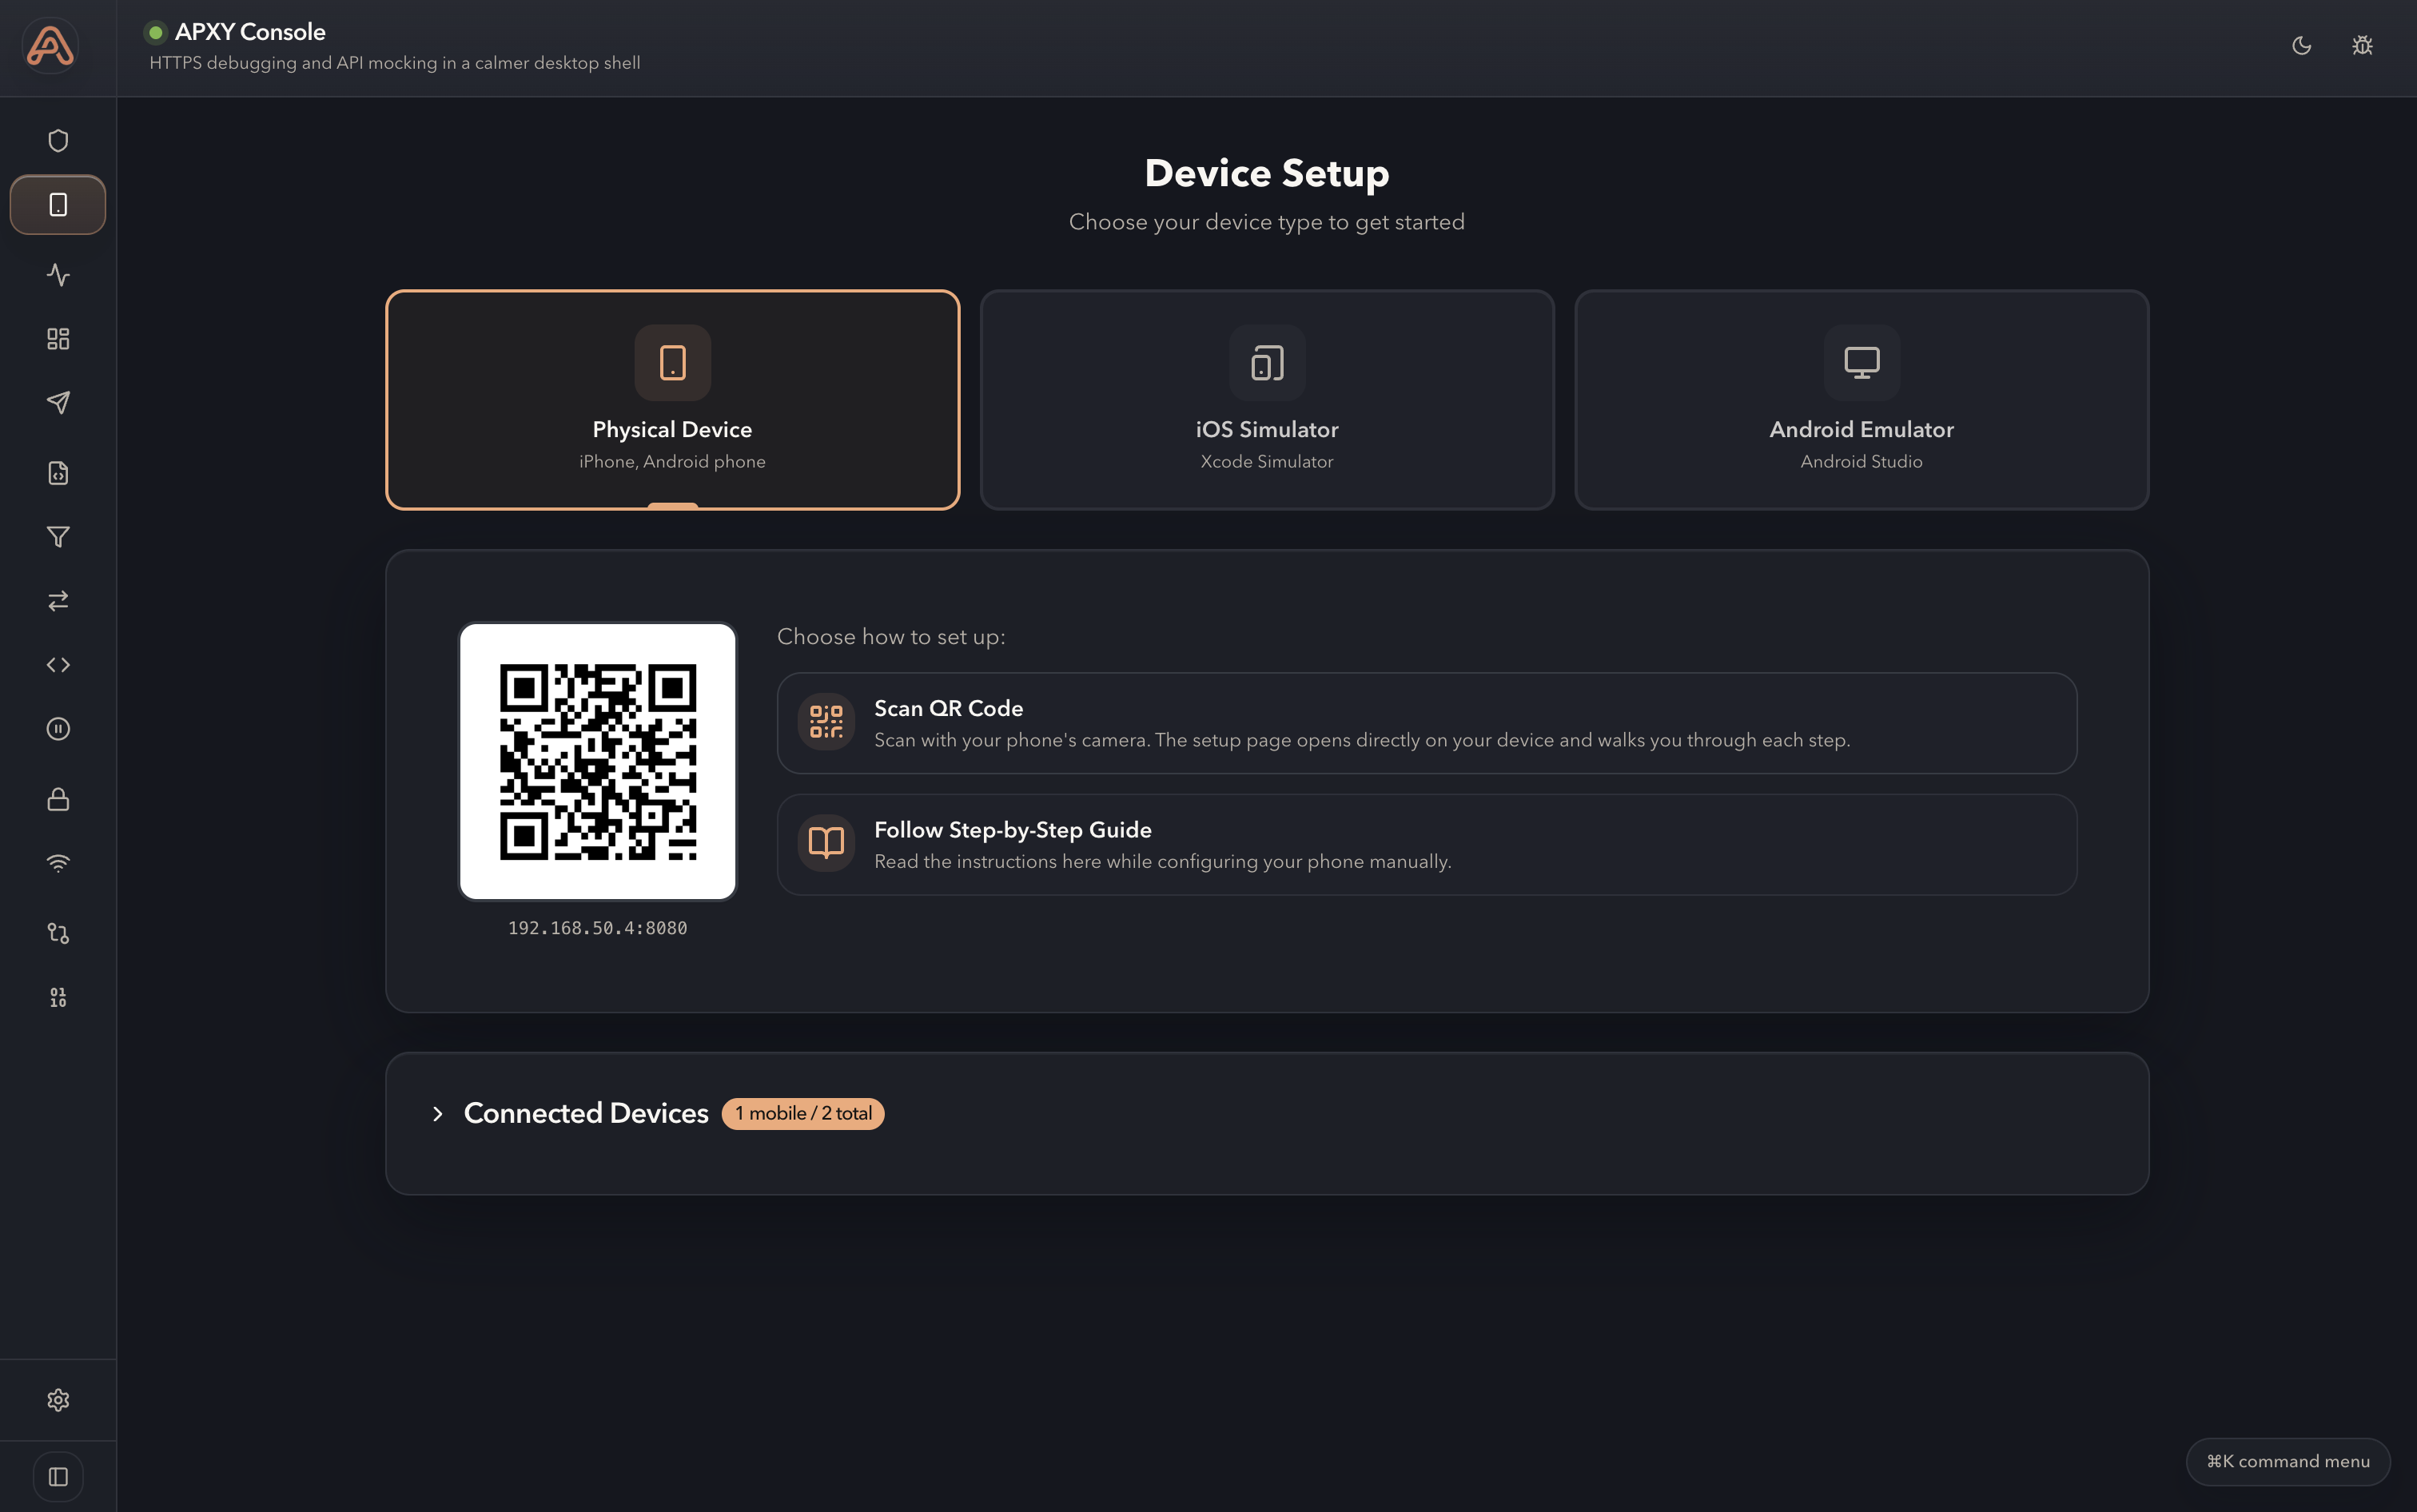
Choose target
Physical device, iOS simulator, or Android emulator
Open guide
QR code or step-by-step instructions from the same panel
Confirm ready
Connected devices appear in the console once traffic is live
Scan once, then continue with a guided flow on the phone instead of hopping between docs and settings menus.
The same setup screen covers real devices, iOS simulators, and Android emulators, so teams use one repeatable path.
The phone guide includes certificate installation and a connection test so encrypted traffic is working before inspection starts.
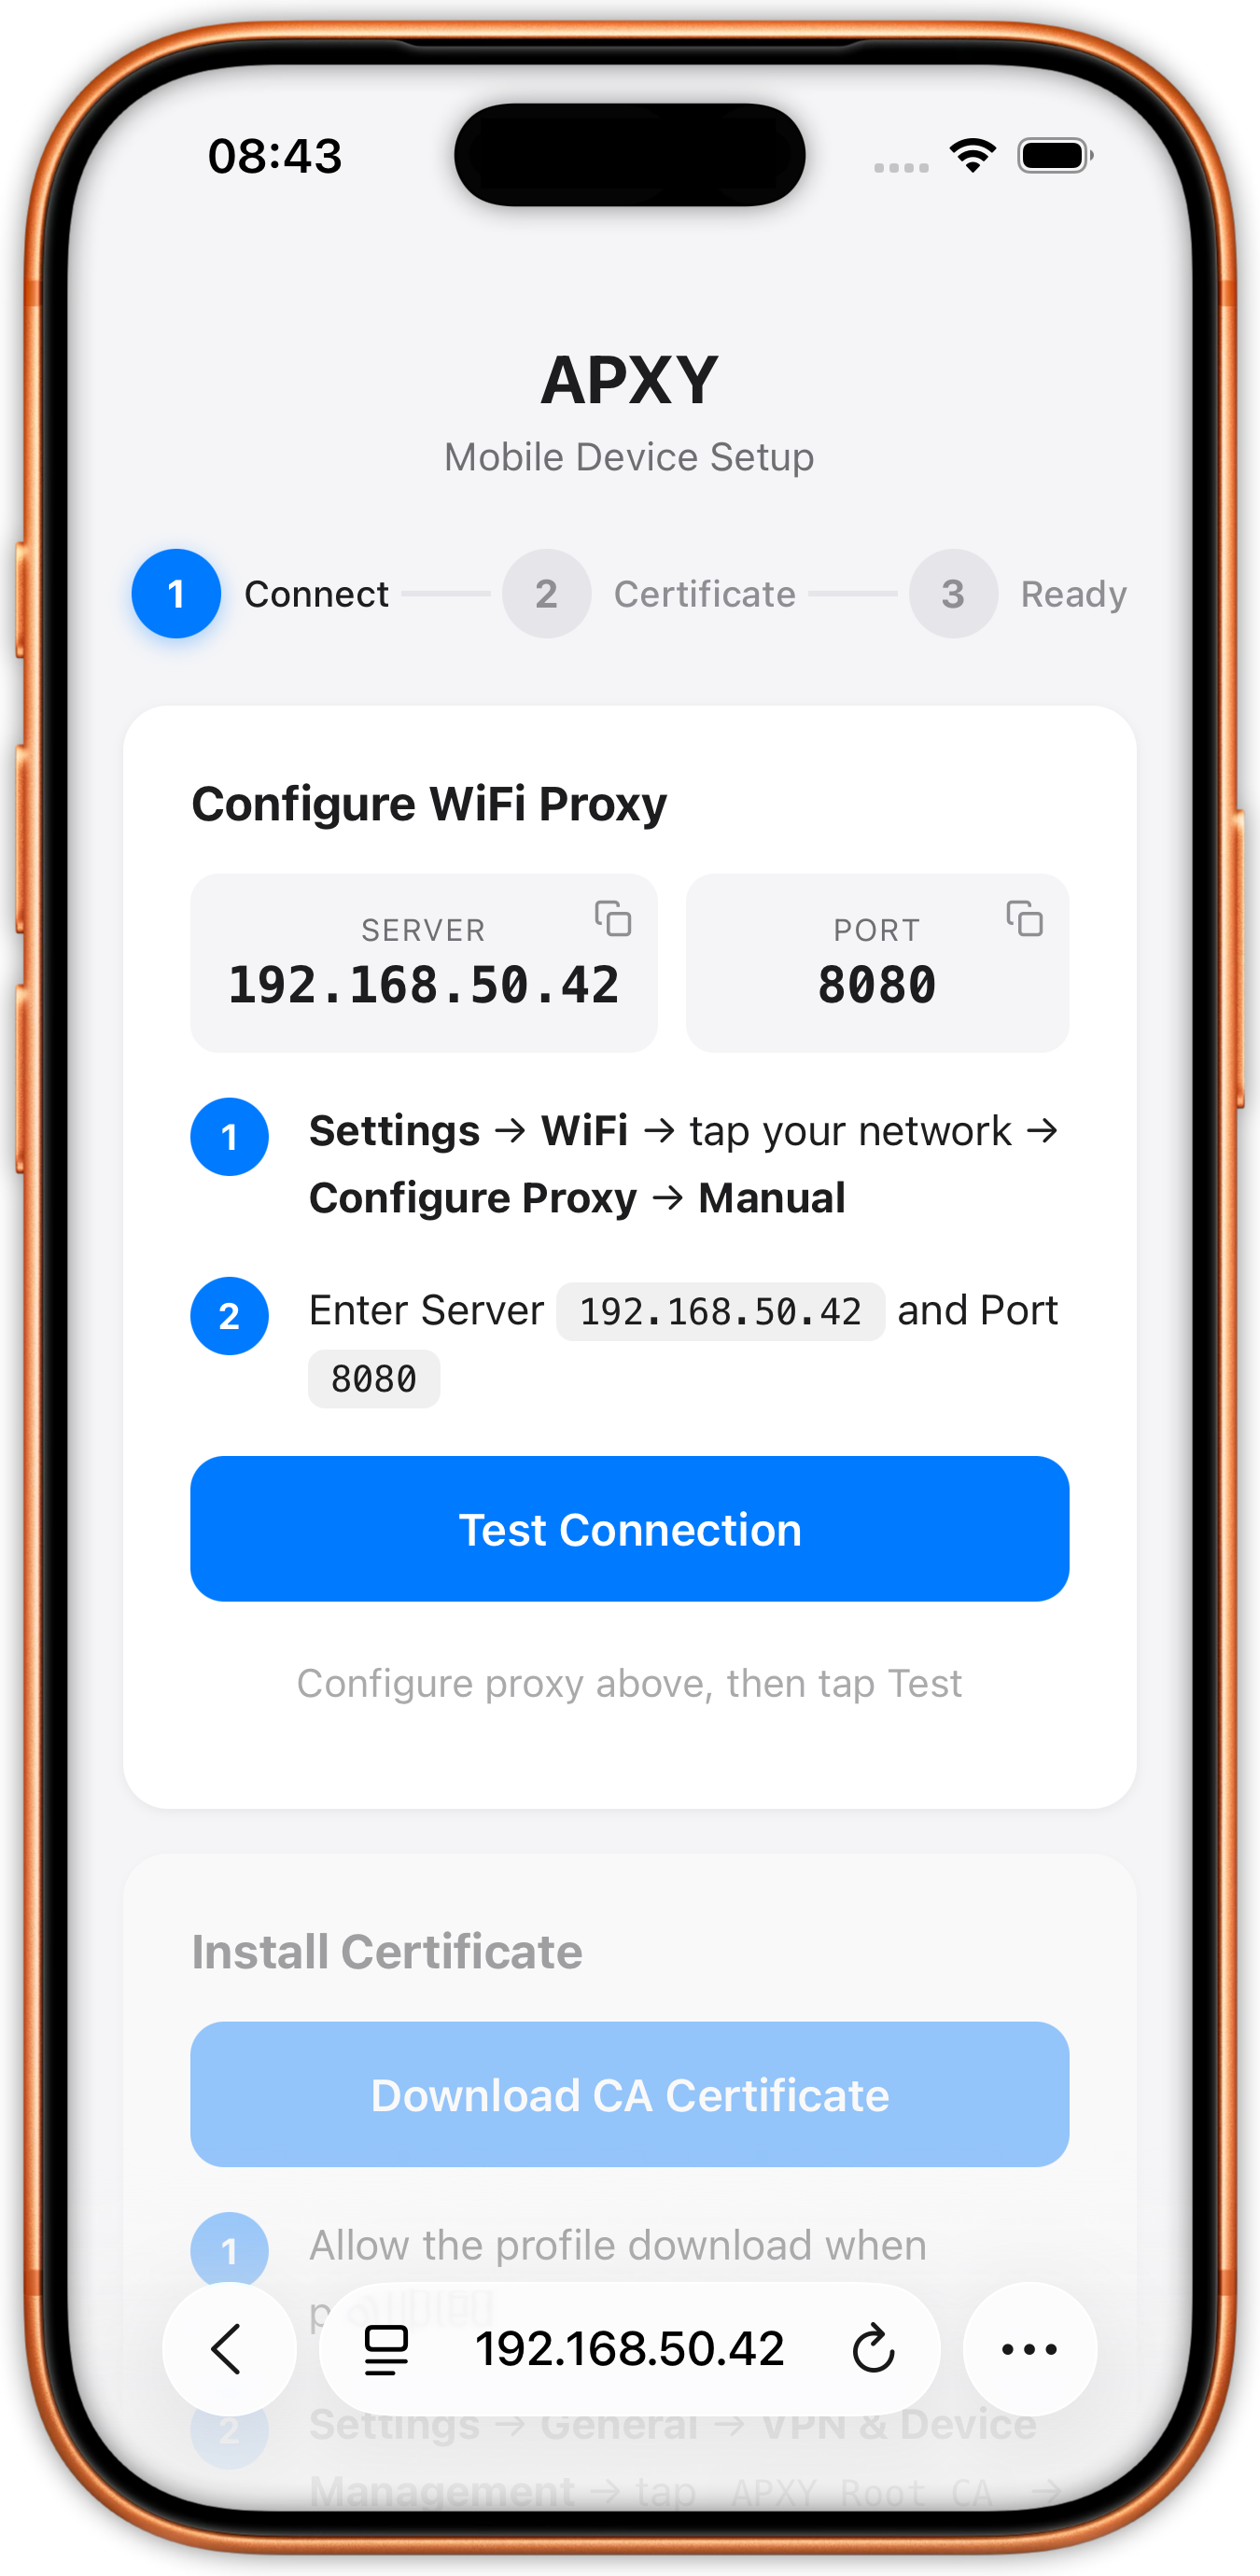
After scanning the QR code, APXY opens a mobile page that shows the exact proxy values, certificate action, and connection test in the order users need them.
Step 2
The mobile view mirrors the real tasks: configure Wi-Fi proxy, install the CA certificate, and tap a connection check before moving on to debugging.
Connect AI agents to APXY with MCP, use apxy setup mcp to register supported clients, then inspect traffic, create debugging rules, and work with Anthropic, OpenAI, Gemini, and more directly from your terminal.
Create a redirect rule to send staging.api.example.com to localhost:3000 for my next test run using APXY.
Redirect rule created successfully:
Any requests to staging.api.example.com will now be redirected to your local development server at localhost:3000. This is ideal for testing AI development work against a staging endpoint, and you can modify or remove it later with the rule ID.
One-time payment, lifetime updates. Start free, then upgrade for unlimited history, advanced debugging tools, and multi-device access.
Capture traffic and explore the Web UI. No account, no credit card.
Unlimited traffic history, API diagnosis, scripting, breakpoints, and network simulation on one machine.
Everything in Pro on two machines — your work laptop and your personal setup.
See exactly what you get with each tier.
| Feature | Free | Pro | Personal |
|---|---|---|---|
| Web UI | Limited | Full | Full |
| CLI commands | Basic | All unlocked | All unlocked |
| Traffic capture | 200 records | Unlimited | Unlimited |
| Mock rules | 3 active | Unlimited | Unlimited |
| Proxy + SSL interception | Included | Included | Included |
| Replay & diff requests | Included | Included | Included |
| API diagnosis | Not included | Included | Included |
| Scripts | Not included | Included | Included |
| Breakpoints (pause & debug) | Not included | Included | Included |
| Network simulation | Not included | Included | Included |
| Export (cURL, JSON, Markdown, TOON) | Not included | Included | Included |
| Custom CA certificates | Not included | Included | Included |
| Settings import/export | Not included | Included | Included |
| Session time limit | 30 minutes | Unlimited | Unlimited |
| Devices | 1 | 1 | 2 |
| Updates | — | Lifetime | Lifetime |
TOON = Token-Optimized Output Notation — a compact format designed for AI agent context windows.